
Let’s change the subject for just a moment. This isn’t something I have any expertise in, so I’m not going into much depth here. But as an admitted science geek with a weakness for infographics, I was immediately enthralled when I stumbled onto this thing of beauty and just had to share. It was exquisitely prepared by Beyond Words Studio (check them out!) for BBC Future. Any wonder why I love the BEEB!?!
It checks all the boxes for a good infographic: it’s informative, well researched, simple to comprehend, and attractive to look at. This one takes the temperature of the universe, showing what happens as temperatures increase.
It begins with the coldest temperature possible, which — if you remember your high school physics — is -273.15ºC or 0ºK, the point at which fundamental particles reach their minimal possible vibrational motion. In other words, everything stops. Remarkably, there is a living organism that can survive, albeit for only a few minutes, at nearly that temperature (-272ºC): the tardigrade, a near indestructible 8-legged micro-animal about 1 mm in length. Even more impressive is the fact that this same creature can survive the highest temperature among all living things: 151ºC.
The infographic also tells you the temperatures of astronomical objects, minimums and maximums on Earth, the hottest temperatures attained by everyday objects (my fave is the max temperature of the brake discs of a Formula One car: 750ºC), and what happens to various elements.
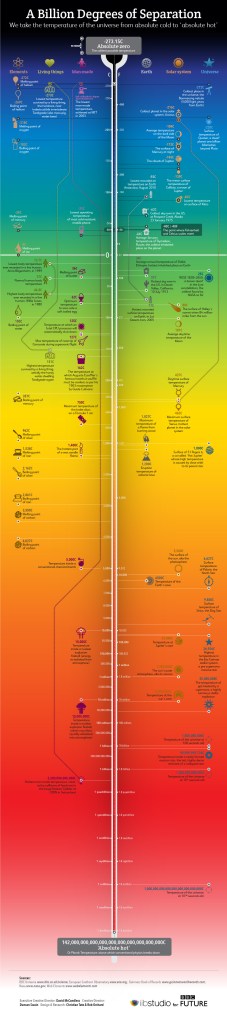
But the best factoid is saved for last. While I’ve known about Absolute cold, I’d never given thought to what Absolute hot would look like. This infographic provides the definitive answer: 142,000,000,000,000,000,000,000,000,000,000ºC, also known as the Planck Temperature, the point above which conventional physics breaks down.
Cool!
